Slow HTTP - The Insidious Killer
Feb 7, 2017 00:00 · 1377 words · 7 minute read
Slow HTTP are application layer Denial Of Service (DoS) attacks and have a potential to knock down a server with limited resources. Because of the nature of the attack (slow speed and low volume), they are hard to detect and can cause equal damage as a high volume DDoS. In this post, I’ll share my experience with these attacks.
Introduction
As explained in the WiKi [1], Slow HTTP attacks rely on the fact that the HTTP protocol, by design, requires requests to be completely received by the server before they are processed. If an HTTP request is not complete, or if the transfer rate is very low, the server keeps its resources busy waiting for the rest of the data. If the server keeps too many resources busy, this creates a denial of service.
Slow HTTP attacks are primarily of three types:
- Slow headers (a.k.a Slowloris)
- Slow body (a.k.a R-U-Dead-Yet)
- Slow read
This post primarily focuses on slow read attacks because at Kayako we were most affected by this than the other two.
Slowloris
This attack works by opening a large number of connections with the web server and keeping them alive by slowing sending never ending headers. The server won’t close the connections as the request is not complete and it will eventually exhaust all the resources on the server, blocking the legitimate requests.
R-U-Dead-Yet
R-U-Dead-Yet works just like Slowloris, but instead of sending never ending headers, it sends never ending POST body, forcing the server to keep the connections open. When all the resources of the server are occupied, it is unable to serve the legitimate requests.
Slow read
The above-mentioned attacks exploit a web server by sending slow requests, however, slow read exploit is based on reading responses from a server very slowly. It works by advertising a very low client receive buffer size, triggering a big response from the server, and taking up to minutes to read a single response. When multiple such connections are created concurrently, it can consume all the server resources and lead to DoS. It can’t be explained better than the author of this attack himself in this post.
Slow read @ Kayako
Though we were resistant to Slowloris and R-U-Dead-Yet, but not to the slow read attacks. On initiating ~4000 concurrent connections with slow reads, we started getting 502 Gateway timeouts on all our desks. The attack was possible even with a single machine, making it even more vicious.
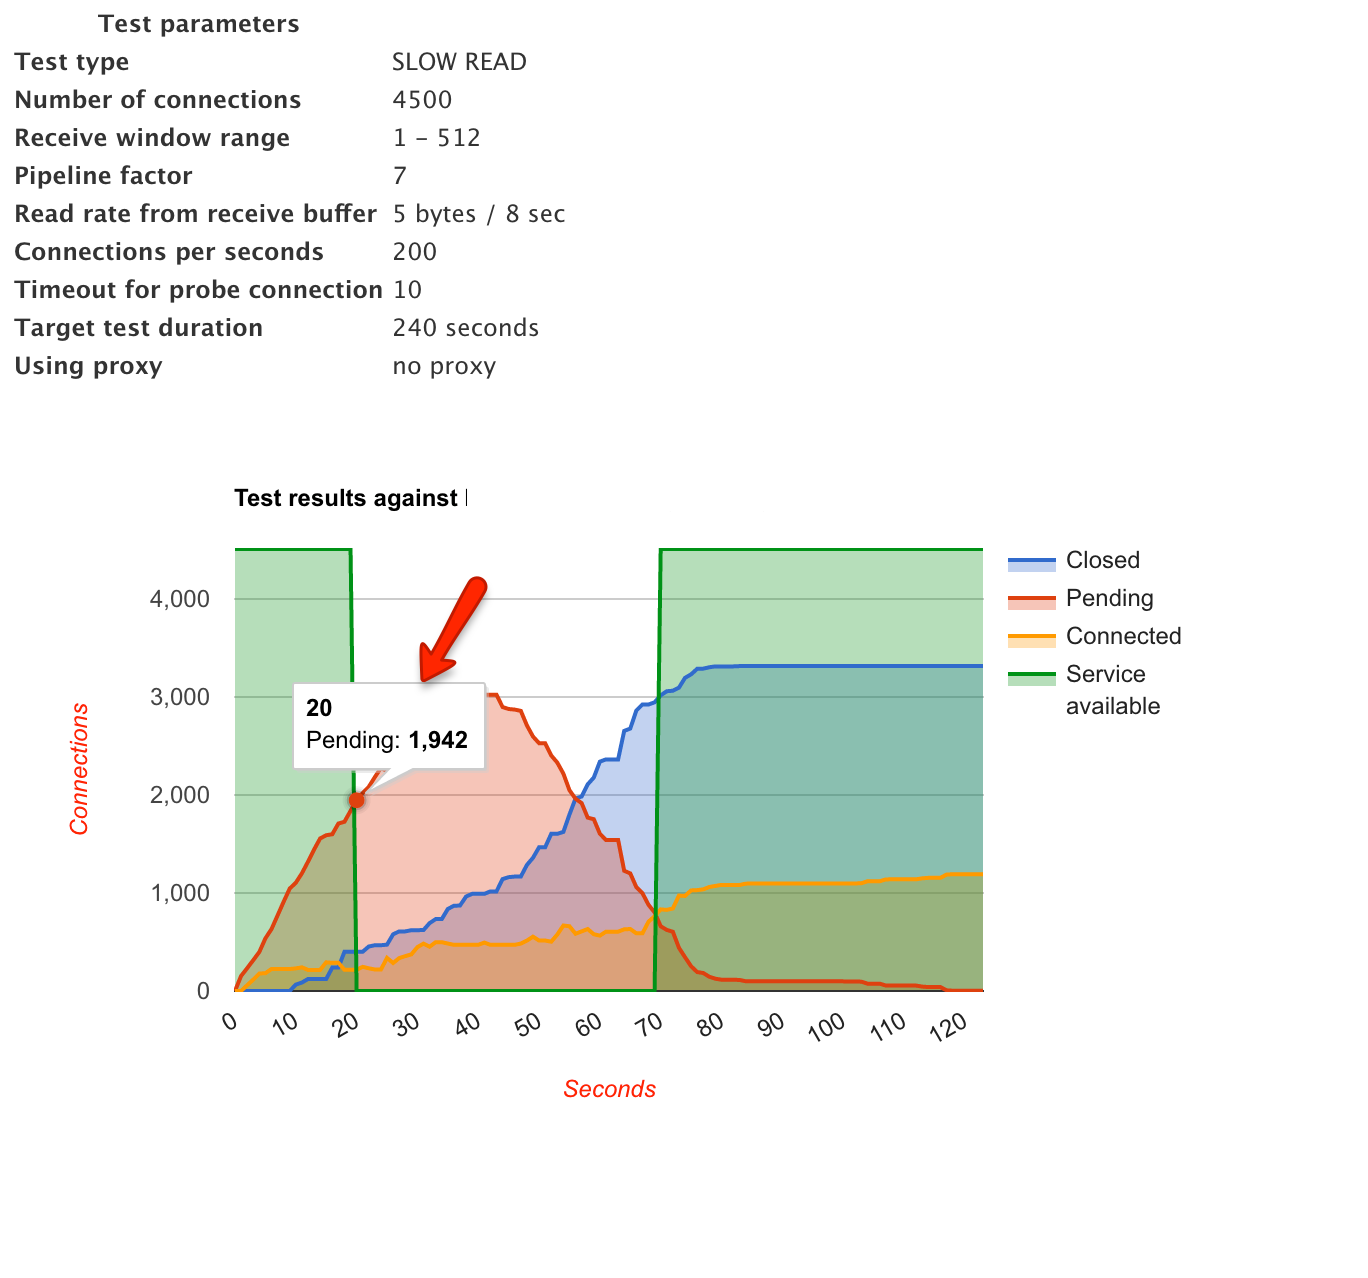
We used a tool called slowhttptest to simulate an attack against our servers and measure the impact. After carefully crafting the attack payload we were able to successfully DoS the server. Here is the graph of attack on one of our servers:
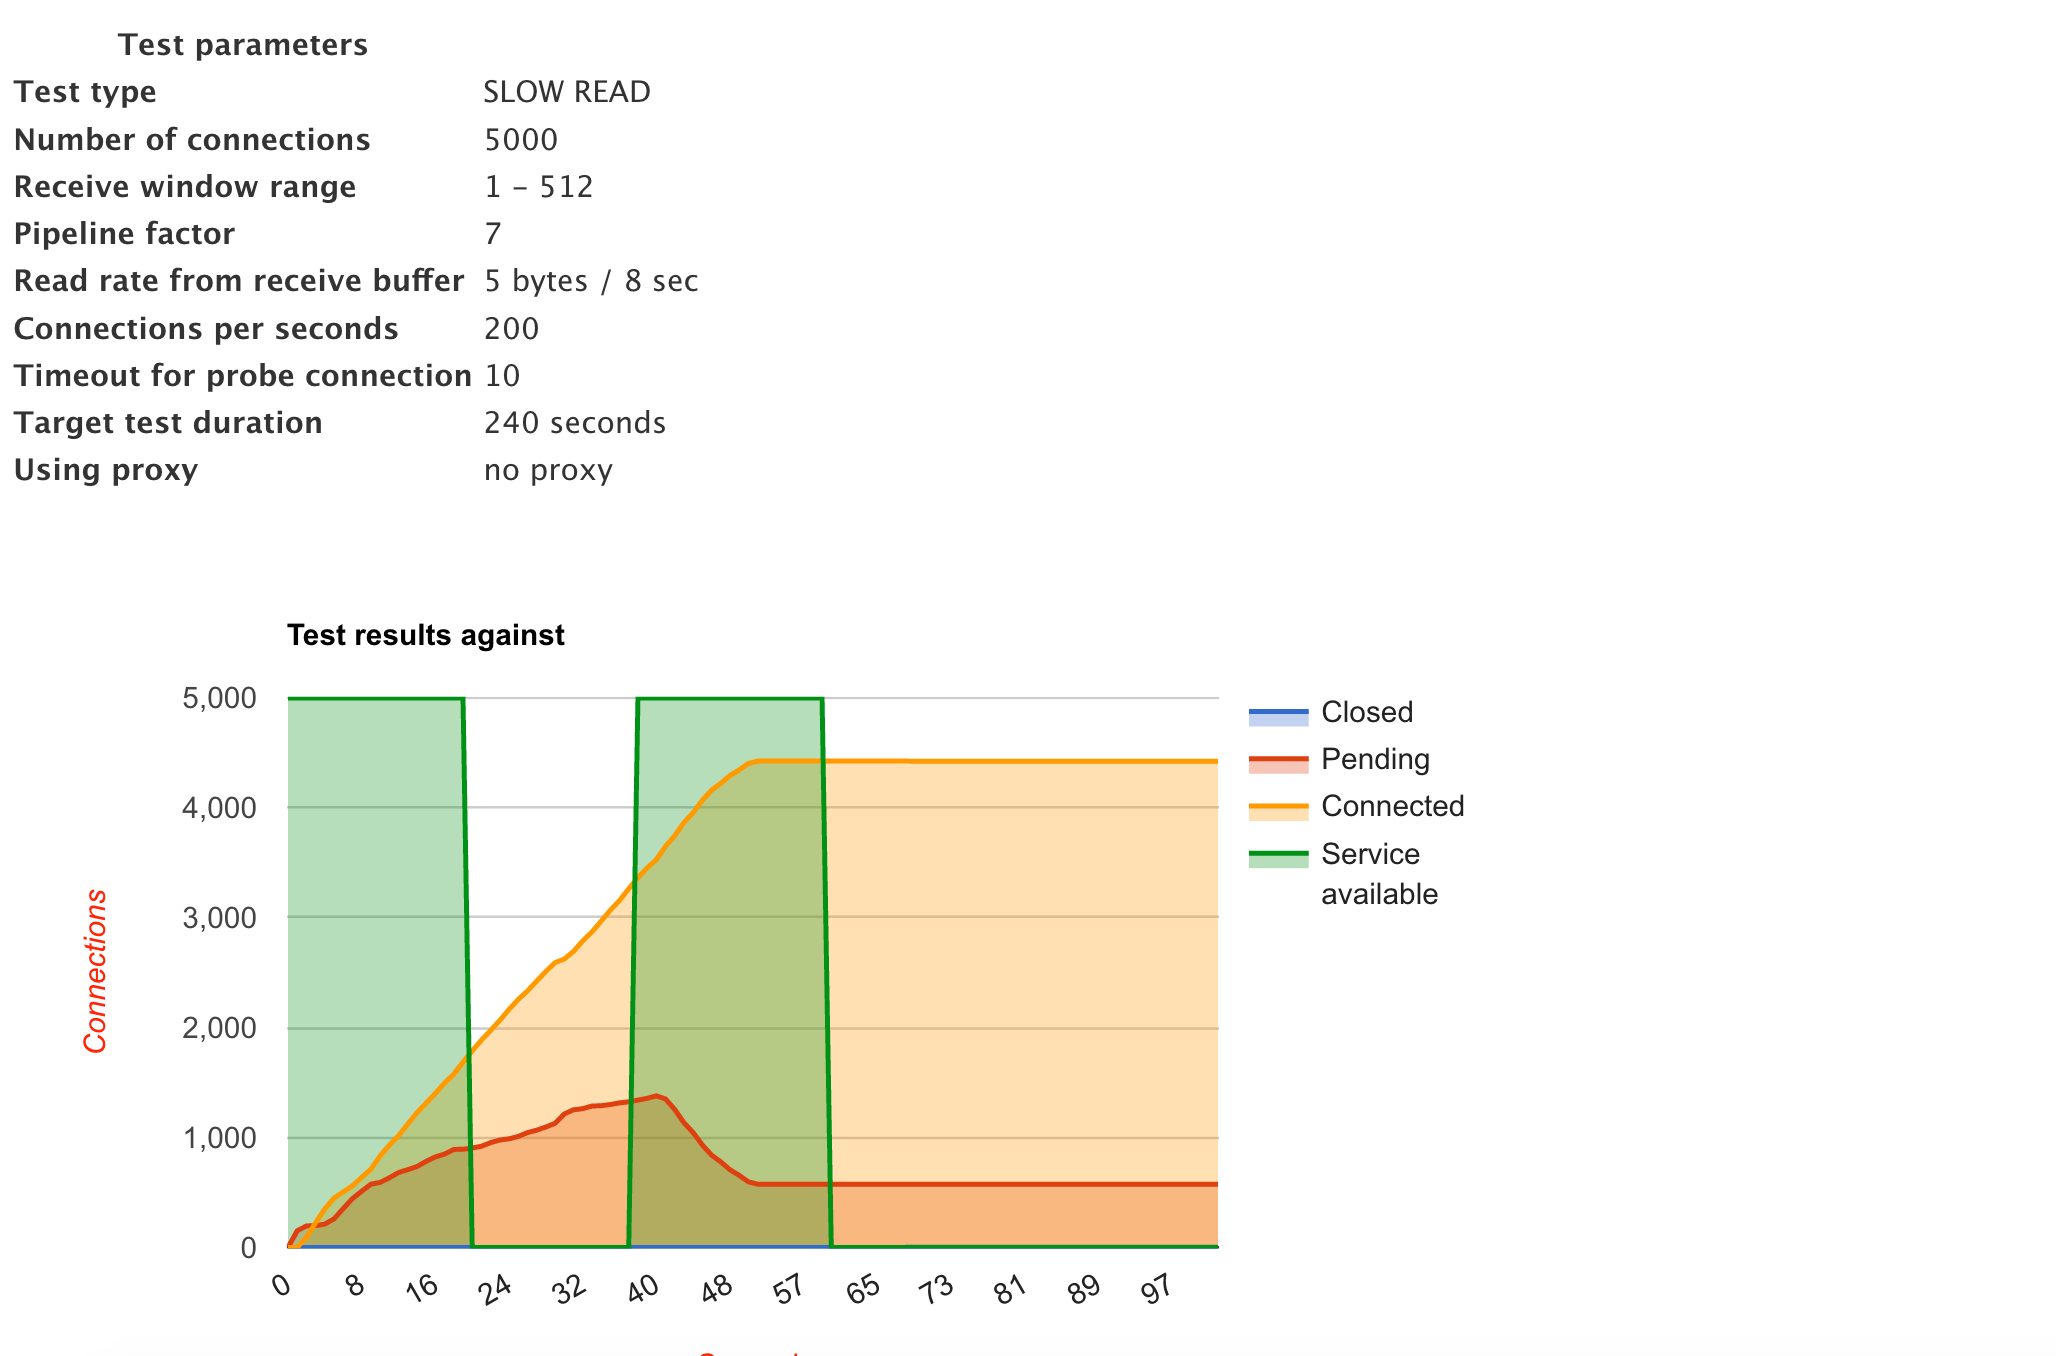
As you might observe from the graph, service was mostly unavailable during the attack window. The connections were consumed linearly and the service became unavailable in 23 seconds. The service was back after a while (by cleaning up old connections) and it went down again.
Before I jump into the fix of the problem, I’ll give a brief background of Nginx, the web server that we use. It is important to understand the Nginx architecture before making any changes in the configuration.
Nginx architecture
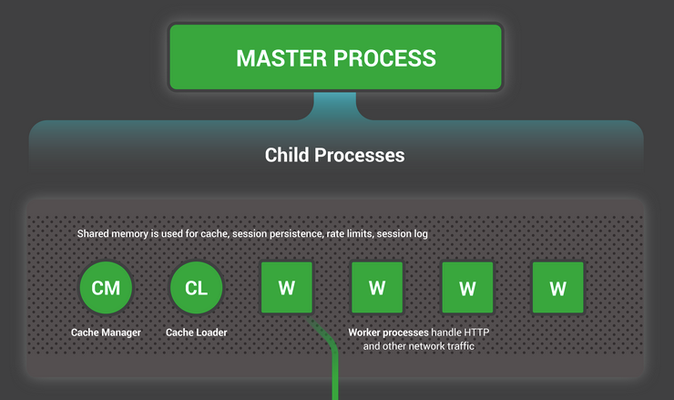
Nginx has a master process and a number of helper processes (including worker processes). Master process manages all the privileged operations whereas the worker processes do the actual work and handle the connections. Nginx’s architecture is fundamentally different from that of Apache’s. Apache spawns a blocking thread for every new connection [4], whereas Nginx is based on non-blocking event-driven architecture. The diagram below summarises the flow:
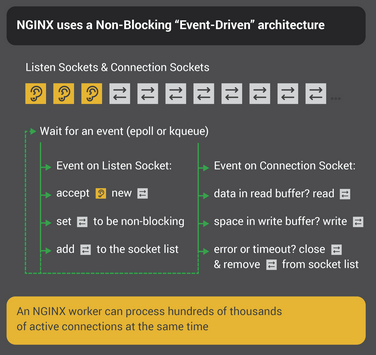
This architecture provides innate prevention against Slow HTTP attacks to some extent as the worker process is not blocked on IO. It can continue to serve other requests. However, it is not full proof and depends on the Nginx configuration options as well.
Some of the common configuration options provided by Nginx to prevent such attacks are:
- limit_req – to limit the rate of requests from one IP
- limit_conn - to limit the number of connections from one IP
- client_body_timeout - to close the connections with slow body
- client_header_timeout - to close the connections with slow headers
- send_timeout - If the client does not receive anything within this time, the connection is closed.
The fix
I added the directives that weren’t present (limit_conn and send_timeout) and tuned the existing directives (client_body_time and client_header_timeout). Here is the comparison between before and after the first iteration (this test was performed on a different server than the previous example):
Before
After
Observe the blue line, the connections are now being closed pretty aggressively because of the timeout values. Also, the total number of connected connections at any given time is far less. The overall availability has increased, but it is still far from ideal.
Second iteration
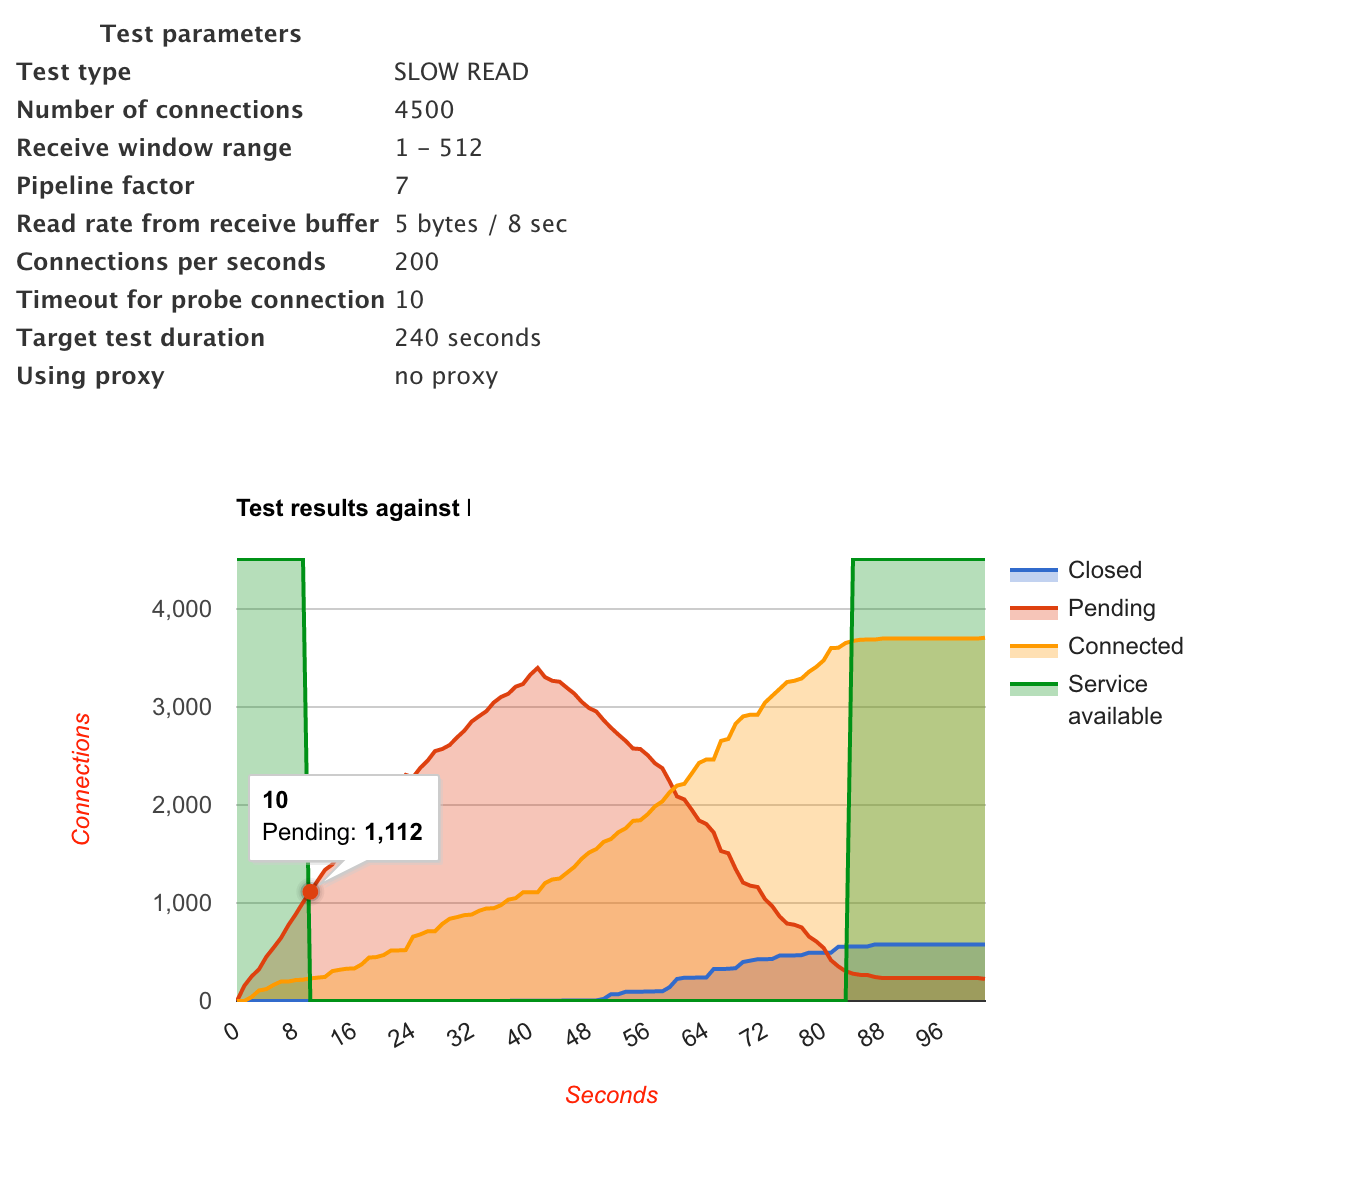
I further tweaked the send timeout and reduced the limit on the number of concurrent connections from a single IP. This time the result was pretty astonishing:
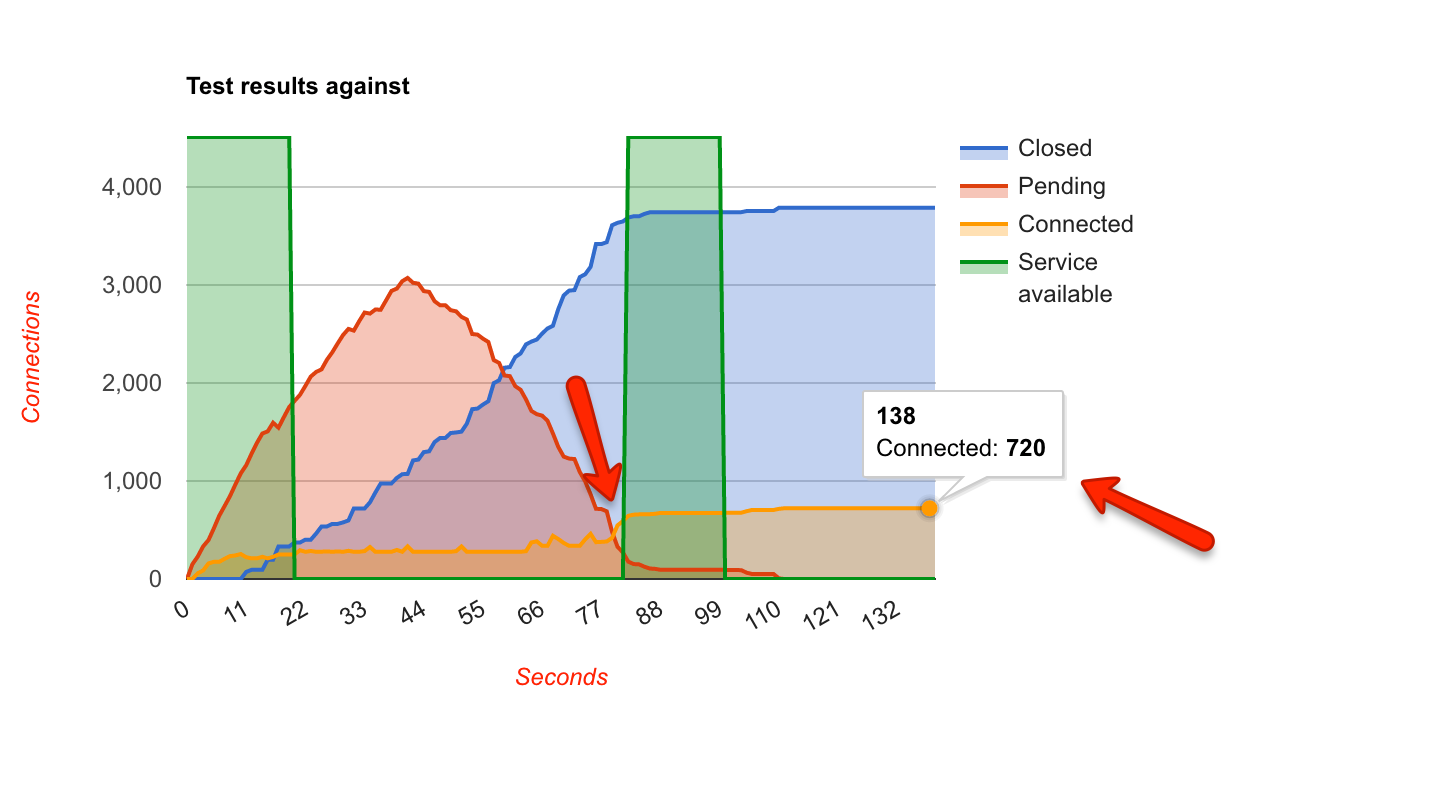
It’s worse than the first iteration. Connections were still being aggressively closed, the pending connections shot up and went down at same rate, however, the service was available for far less time. There was no obvious explanation for this behaviour.
Third iteration
Just to benchmark how an ideal graph will look like, I ran the tests on Google:
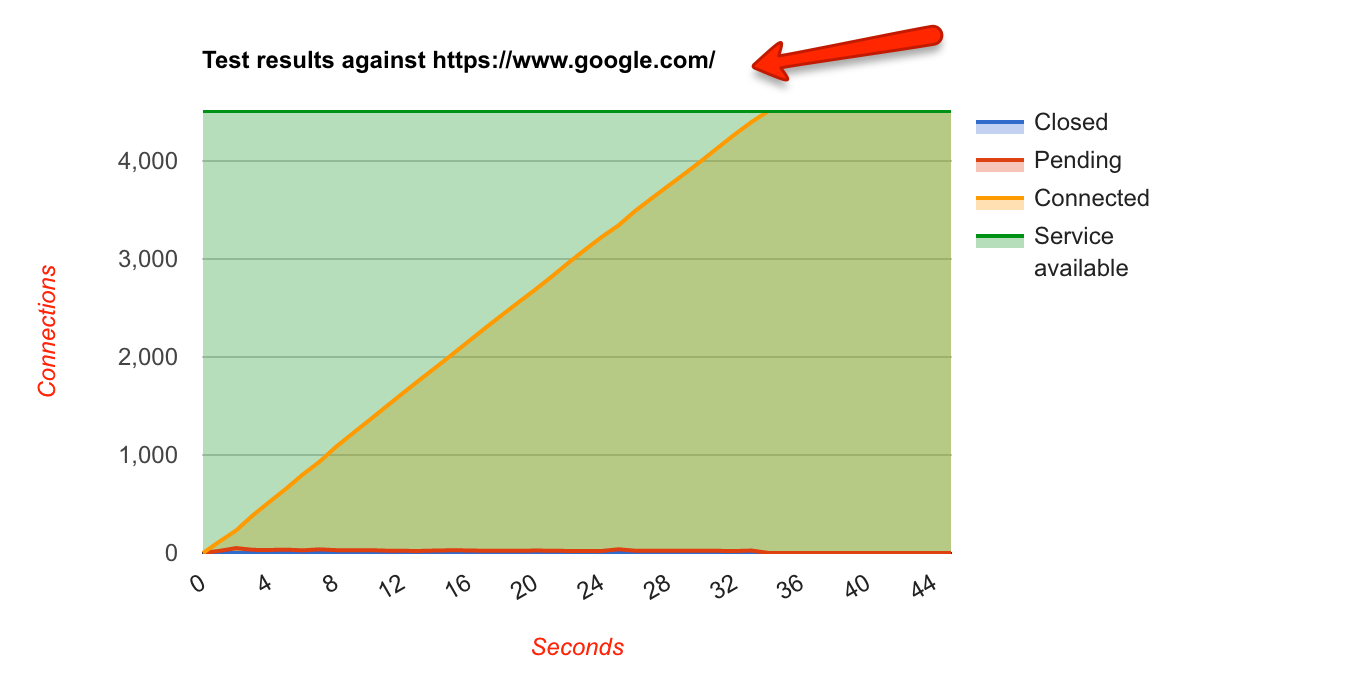
None of the connections were closed and service was available throughout. Also, the pending connections were almost zero throughout the test.
Just to get a distinct deviation in the graphs, I reduced the number concurrent connections from a single IP down to two on our servers. The results were surprising again:
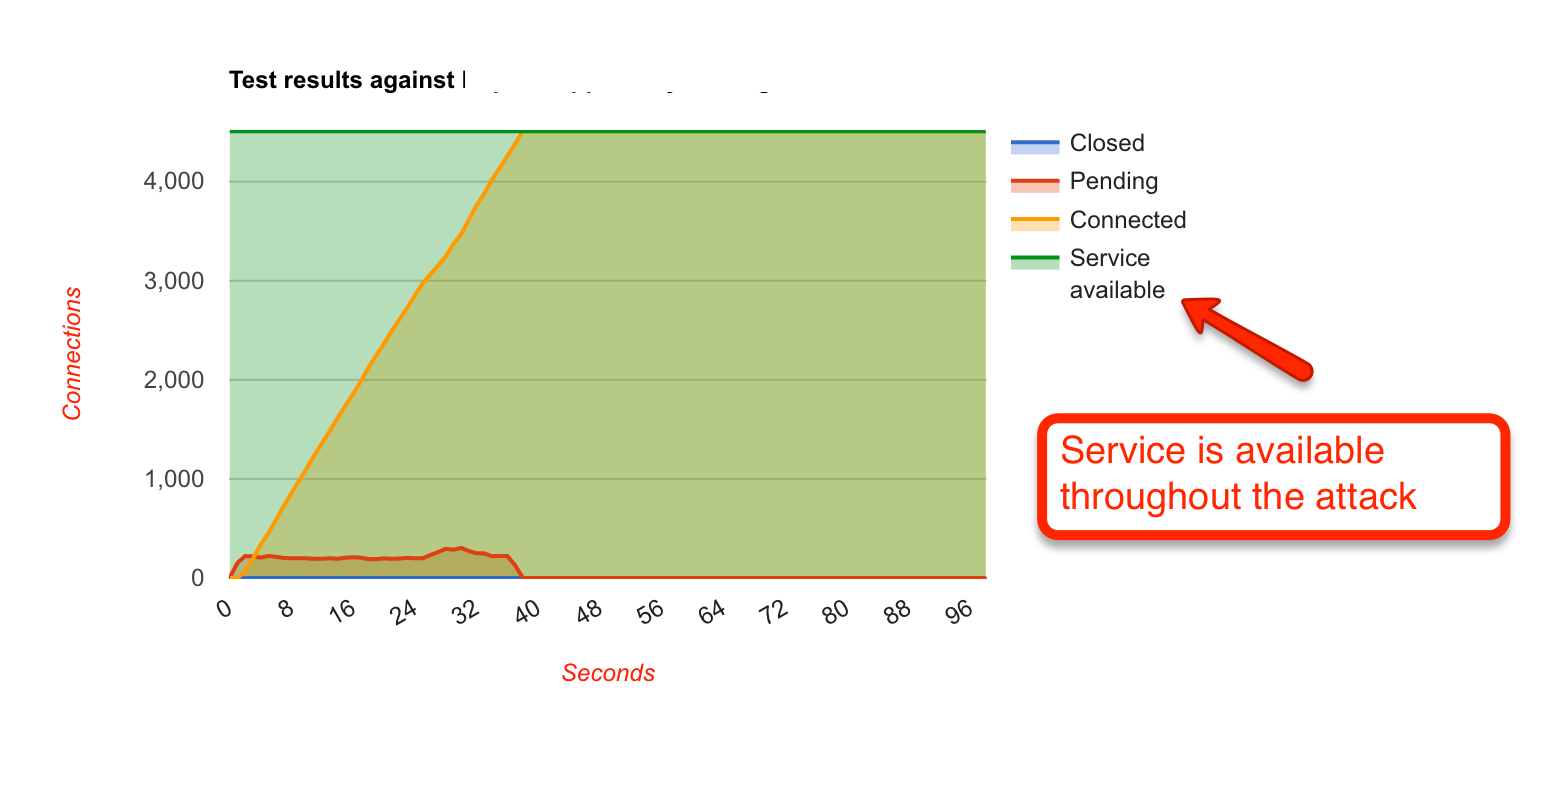
Since the concurrent connection count was reduced to two, I was expecting it to show service as unavailable immediately after the start of the test (because all the subsequent requests will be throttled and 503 response code will be returned). Instead, the graphs showed 100% availability and looked pretty similar to that of Google.
These results made me question the criteria of “availability” as per the tool. I dug into the codebase to find when does it consider a service to be available or unavailable. From my observations, it considers a service to be available if the server is able to respond to the request in a given time-frame. Since 503 is also a valid response, hence the tool marks the service as available. This also implies that if there are client-side connection issues (maybe because of too many connections?), it will consider the service to be unavailable, whereas in reality, it might not be the case . Therefore we can’t completely rely on the availability data of the tool.
Therefore, for all the future tests, I used a different device with a different internet connection to check the availability of the service.
Fourth Iteration
This time I decided to manually check the availability from a different device. I ran the tool on the first device and got expected 503 responses in the web browser. Surprisingly, when I opened the webpage from a different device with a different IP, I still got the same 503 response. It implied that the requests from all the IPs were being blocked, making the mitigation useless as the service won’t be available to any of the users. On debugging I found the following:
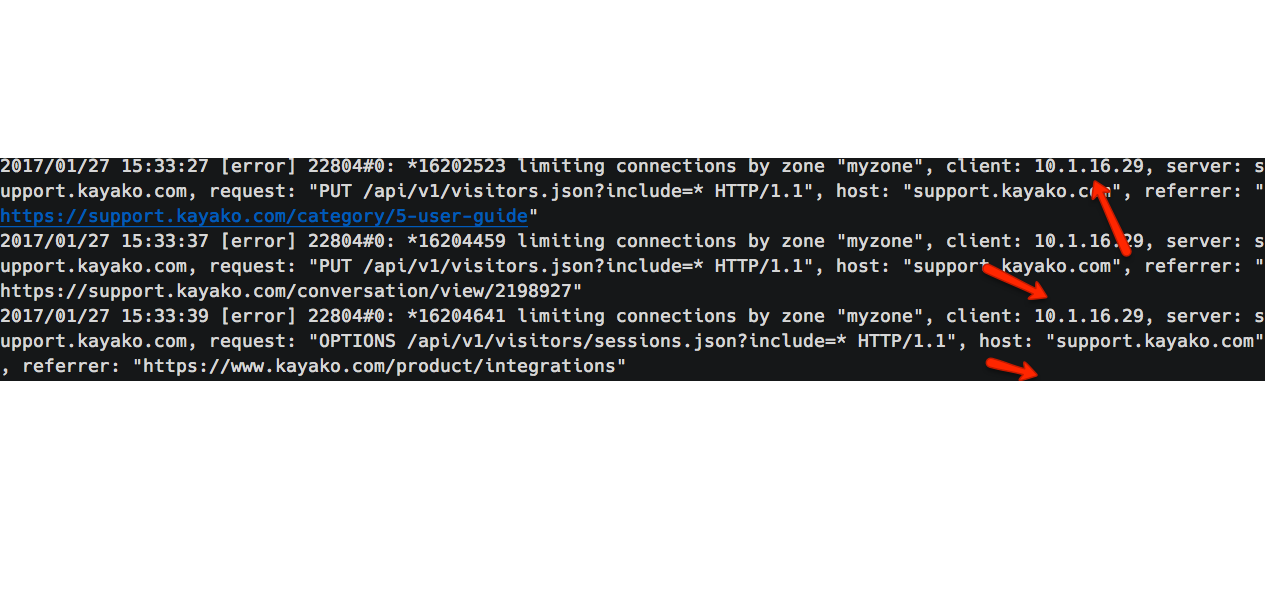
The Nginx logs were showing client IP as that of private IP of our load balancer. The problem was clear now, we weren’t handling the IP addresses correctly in our Nginx configurations. I configured the real IP module of Nginx and re-ran the tests. The results were great:
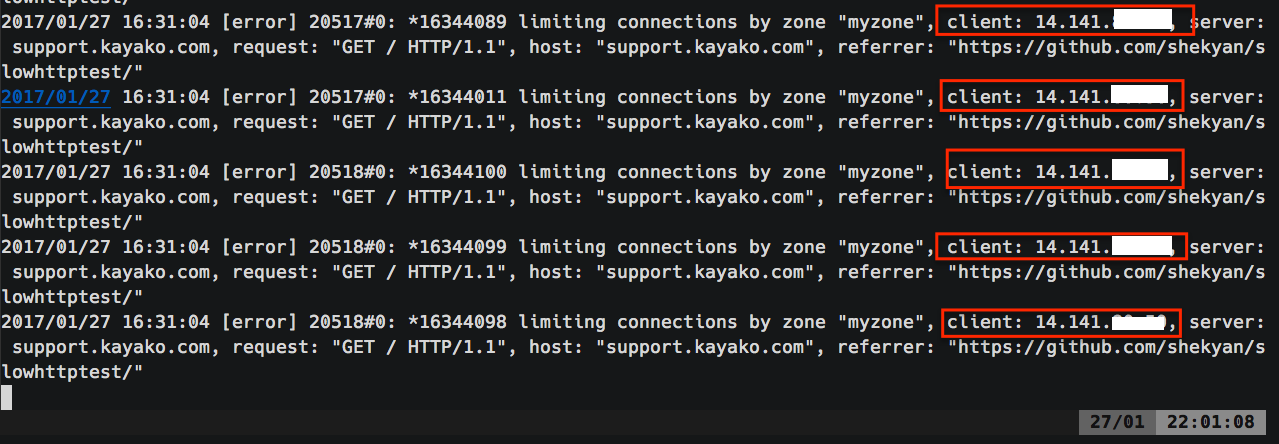
All the IPs were correctly being identified by the Nginx, clients opening too many concurrent connections were being throttled, and all the legit requests from different IPs were being served normally.
Conclusion
Slow HTTP attacks can be as vicious as volumetric DDoS attacks, if not dealt properly. Moreover, there are a lot of moving parts in the Nginx configuration and we need to understand them properly before making random copy/paste changes.
I also see one more fix to this problem by rejecting very low client-side receive buffer window sizes, but I’m yet to explore that path.